Look up San Gabriel home prices right now and you'll find two numbers sitting on the same page, pointing in opposite directions. One says the market is up. The other says it's down. Neither is wrong. So which one should actually change how you price a listing or size up a purchase?
The answer says less about San Gabriel's economy than it does about how few homes are actually changing hands here, and what kind of homes they are.
The Same Report, Two Different Answers
Over the three months ending June 2026, San Gabriel's median home price climbed to $1.2 million, up 4.2 percent from the same period a year earlier. That's the number most portals lead with, and it reads like a market on the move.
Sit right next to it, though, and you'll find that the average sale price for June 2026 alone was $998,000, down 10.9 percent from June a year before. Same city, overlapping timeframe, opposite trend lines.
This isn't a typo or a data error. Median and average measure different things. The median is the price of the home that sits exactly in the middle of all the sales, ranked low to high. The average adds up every sale and divides by the count, which means a handful of unusually expensive or unusually modest closings can drag it around in ways the median never feels. When those two numbers disagree, it's usually because the mix of what sold changed, not because home values as a whole did something dramatic.
Why So Few Sales Can Swing the Line
San Gabriel doesn't move a lot of inventory in any given month, and that's exactly why the mix matters so much. Just 44 homes sold in June 2026, up modestly from 40 in June 2025. In the first quarter of 2026, only 32 deals closed citywide, an 11 percent drop in transaction volume from a year earlier.
When your entire sample size for a month is a few dozen homes, one or two closings at the very top of the price range can move the average by tens of thousands of dollars without budging the median at all. Zoom into the Central San Gabriel submarket and the effect gets extreme: over the three months ending May 2026, the median there was down 10.9 percent year over year to $1.1 million, a modest pullback. The average for the most recent single month on record was down 41.1 percent. A drop that steep in the average, with the median barely moving, almost always means a small number of very high-priced sales that closed a year ago simply didn't repeat this year. The typical home held its ground. The tail of the distribution moved.
The lesson for anyone pricing a home here isn't "the market is up" or "the market is down." It's that the headline number depends entirely on which handful of homes happened to close that month, and whether your home looks like them.
The Two Tiers Under One Zip Code
That handful of high-end outliers isn't random. San Gabriel's housing stock genuinely splits into two eras that price very differently per square foot.
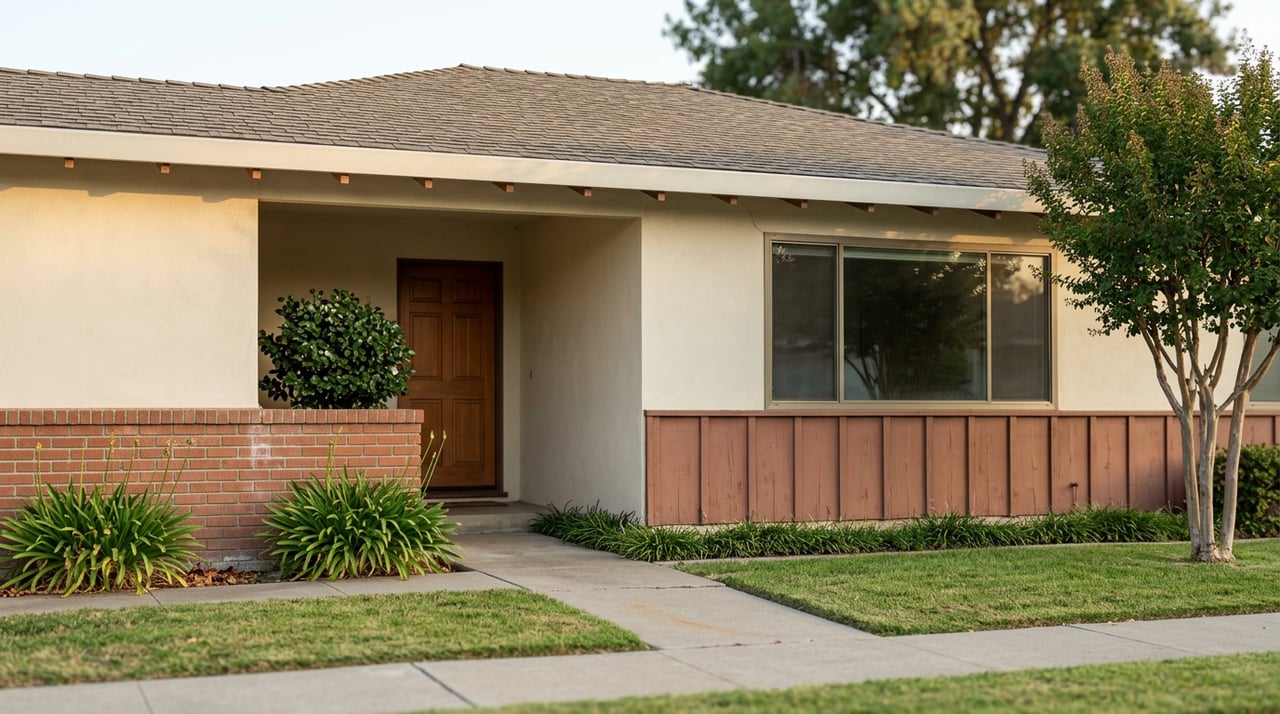
The bulk of the city is post-war single-family homes and classic ranch houses, many of them in older, established tracts that carry no HOA dues and no Mello-Roos assessments, a real cost advantage buyers should weigh alongside the sticker price. Layered into those same streets is a growing share of newer, larger homes, the product of years of teardown-and-rebuild activity replacing smaller mid-century houses with custom construction.
The gap between those two tiers shows up clearly in the numbers. Citywide, the median price per square foot in the first quarter of 2026 ran $741. Compare that to a new-construction listing on the market that April: a 2,949-square-foot custom build at 900 Euclid Ave, listed at $2.4 million, which works out to roughly $814 per square foot. That's about 10 percent above the citywide median on a per-square-foot basis, for a single home, and it's the kind of listing that can single-handedly reshape a month's average when it closes.
| Legacy Stock (post-war / ranch) | New Construction / Rebuilds | |
|---|---|---|
| Typical era | 1940s-1970s | Built or rebuilt in recent decades |
| HOA / Mello-Roos | Generally none in older tracts | Varies by project |
| Price per sq ft (approx.) | Near the $741 citywide Q1 2026 median | $800+ on recent listings |
| What moves the number | Sets the median | Swings the average |
Neither tier is "the" San Gabriel market. Both are, and a seller or buyer who doesn't know which one they're standing in is comparing their home to the wrong baseline.
The Pipeline That Keeps Widening the Gap
This split isn't static. It's actively being built out. In June 2026, plans advanced for 80 homes at 824 S. Gladys Ave, with a mixed-use residential development already underway across the street. Further down the pipeline, the Pacific Square project at 700 S. San Gabriel Boulevard began framing in early 2025 and will add ground-floor commercial space beneath new housing, and as of September 2025, an upsized rendering had been revealed for the Rubio Village project at 201 San Gabriel Boulevard, a mixed-use residential complex bisected by the Rubio Wash.
Every one of these projects adds to the newer-construction tier without touching the older tract housing that still makes up most of San Gabriel's resale inventory. As more of that new stock closes escrow over the next few years, expect the gap between "median" and "average" to keep showing up, not because the whole city is getting more volatile, but because the city now genuinely contains two different products under one name. You can track ongoing project details through Urbanize LA's San Gabriel coverage.
What This Means If You're Buying or Selling
If you own a mid-century ranch home and you've seen "San Gabriel up 4.2 percent" somewhere online, don't assume that's your number. Here's how to translate the citywide data into something that actually applies to your situation:
- Pull comps by era, not just by neighborhood. A 1950s three-bedroom should be priced against other homes of similar age and lot condition, not against a new-construction listing three doors down.
- Watch days on market, not just price. The typical San Gabriel listing took 37 days to sell as of mid-2026, up from 34 days a year earlier. That's a small shift, but it means pricing precision matters more than it did a year ago.
- If you're buying entry-level, the average is misleading you in your favor. A big chunk of that $998,000 average is being pulled up by a small number of premium new builds. Homes priced near the citywide median may face less competition from move-up buyers than the average suggests.
- If you're building or buying new, price per square foot is your real benchmark, not the median sale price. Recent new-construction listings, like the one on Euclid Ave, have priced closer to $800 per square foot against a citywide median near $741, and that spread is a real part of the cost of "new" in this market.
A Few Questions Worth Asking Before You Price Anything
Why don't the median and average agree? They're measuring different things. The median tells you what the middle-ranked home sold for. The average can be pulled around by a small number of very high or very low sales, which matters more in a market where only a few dozen homes close each month.
Does this mean San Gabriel values are actually falling? Not necessarily. The median, which better reflects the typical transaction, was up 4.2 percent over the three months ending June 2026. The average dropped because the specific mix of homes that closed shifted, not because comparable homes are worth less.
Should I wait for the new construction pipeline to finish before selling my older home? New builds and legacy resale homes serve different buyers, so one seldom directly competes with the other. The bigger question is timing your own sale against your own comps, not against projects still under construction.
Pricing a home in a market this segmented takes more than a portal estimate. If you're weighing a sale or a purchase in San Gabriel and want a read on where your specific property actually sits between these two tiers, Tony Dowdy can walk through the comps that matter for your home, not just the citywide headline. Get a Free Home Valuation and find out what your address is really worth in this market.